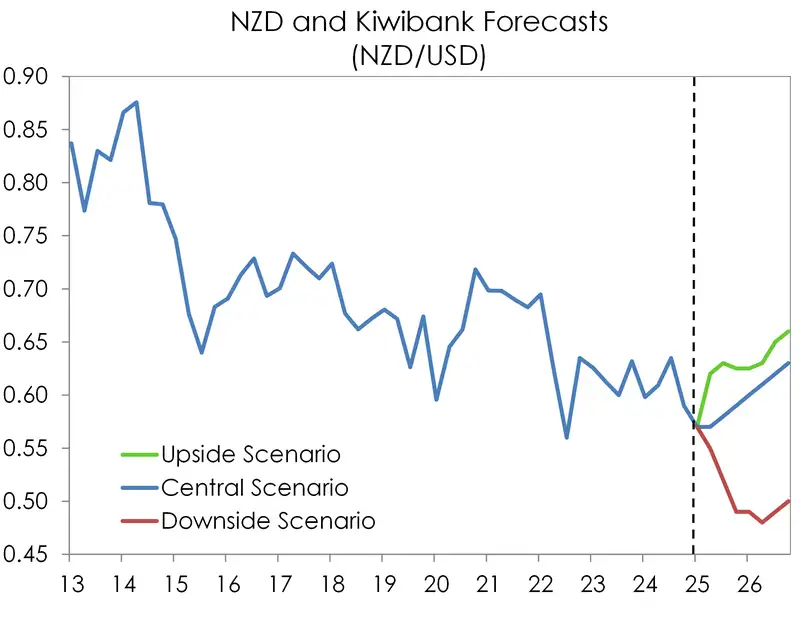
- Widening interest rate differentials and heightened global uncertainty clipped the Kiwi bird’s wings in 2024. From here, we see the Kiwi remaining rangebound at current levels before an eventual climb to 60c by year-end, supported by a recovery of the domestic economy.
- That's the central scenario. But downside risks dominate. Our primary concern is the growing risk of a global slowdown driven by escalating geopolitical tensions and tariff trade wars.
- It’s hard to argue against current market pricing. A 3% terminal cash rate is almost perfectly priced. Short-end rates are well-anchored. Should more stimulatory policy be required, there’s scope for interest rates to move lower, and the Kiwi to test its recent lows.
Short Kiwi dollar (NZD) was a trade we championed all throughout 2024. Back in April, we wrote: “Ultimately our forecasts for the kiwi dollar are unchanged with the Kiwi declining to 57c by year-end”. Even when the bird caught wind and drifted to 63.5USc, we held onto our rather out-of-market call for a Kiwi with a 50-cent handle by year-end. The way we saw it, interest rate differentials were working against the Kiwi. Compared to the US Federal Reserve, the RBNZ was (and remains) on a more rapid cutting cycle. Kiwi cash had fallen below US cash, and the carry on the Kiwi collapsed. Add to that, the ‘Trump trade’ later in the year, which bolstered the Greenback (USD). In our last FX Tactical, we wrote: “As we think about the Kiwi heading into 2025, we see further downside risk. The bird is likely to trade towards 57c, and possibly 55c.” Sure enough, the Kiwi flyer fell below 57c in late December, hitting 55c in early Feb – slightly sooner than anticipated, but the call played out nicely. We pat ourselves on the back. But we won’t get carried away. Because in the world of FX, there’s a little known saying: one day you’re a rooster, the next, a feather duster. But we hope to be crowing for a little while longer. So onto the next one…
In the near-term, we see the Kiwi dollar remaining largely rangebound. Holding here at around 57USc-58USc looks likely, before an eventual climb to 60c by the end of the year. The trajectory of interest rates is key to the outlook. And it’s hard to argue against current market pricing. If we look at the OIS (Overnight Index Swap) curve, pricing has been relatively stable, in line with the RBNZ’s OCR track. Traders have 24bps priced into the April meeting, and 20bps in the May meeting, taking the implied cash rate to a trough of 3.1%. We argue a third 25bp rate cut in the September quarter will be needed, returning policy to the Goldilocks setting of a 3% cash rate. Markets are still mulling over that one. We’ll take the other side of that bet. Regardless, the outcomes of at least the next two RBNZ policy meetings are largely baked in. By consequence, the short-end of the wholesale rates curve is well anchored. The all-important 2year swap rate continues to oscillate within a reasonably tight range of 3.40%-3.60%.
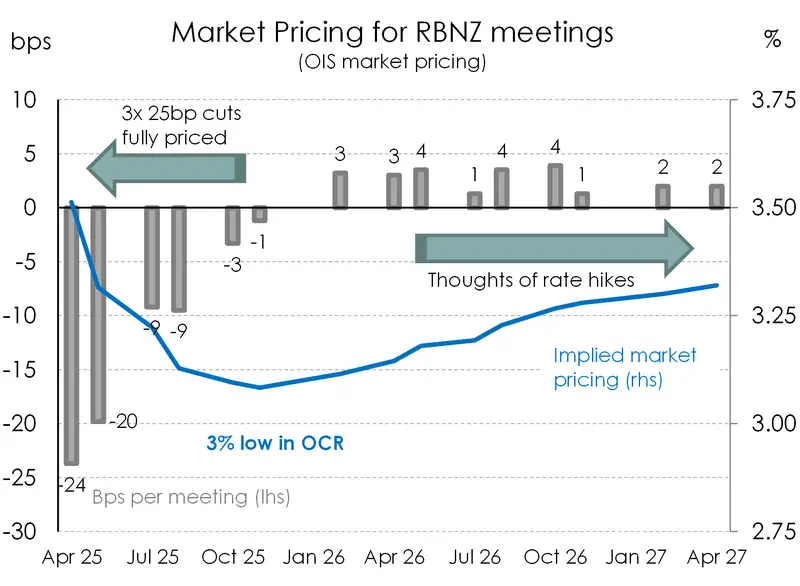
Further along the curve, rates are more influenced by (volatile) global developments. Growing expectations of the next turn in the cycle is also putting upwards pressure on wholesale rates. Always one step ahead, traders have begun to price in rate hikes from late 2026. The expected economic recovery is still yet to gain traction, but markets are simply trusting the process. Significant policy easing delivered in a relatively short period of time should see economic growth pick up the pace later this year. As the outlook brightens, talks of rate hikes will naturally grow. That’s just how economic cycles work. A tightening in policy in 2026 may be too premature. Rather, 2027 may be the more appropriate timing for the next chapter. But we can debate that closer to the date. Here and now, more rate cuts are due.
There’s little in the way of domestic catalysts that could push the Kiwi out of current ranges. Our central scenario still sees the Kiwi economy gradually recovering over the second half of this year. More timely data are already showing promising signs of a turnaround in activity. From PMIs popping into positive territory to healthy export earnings for the rural sector, greenshoots are emerging. However, we still see risks as skewed to the downside for the economy, and therefore downside risk to interest rates and currency too. And those risks are predominately from offshore.
We're increasingly concerned about the global backdrop. Between escalating geopolitical tensions and growing risk of geoeconomic fragmentation, the global outlook is shrouded in uncertainty. That’s not great for the Kiwi ‘small, open’ economy. While we’ve managed to stay off the Trump tariff country hit list (for now), the ramifications of an escalated trade war could hurt us significantly. Fears of a global growth slowdown are building given the level and scope of the tariffs proposed. And in that environment, demand for Kiwi exports will come under pressure. It certainly doesn’t help that our two key trading partners are at the forefront of the trade war. Such a scenario could stall the Kiwi economy’s expected recovery, requiring the RBNZ to push the cash rate below 3%. It is a scenario that’s certainly not outside the realms of possibility, yet one the market has not priced. There’s scope for the Kiwi to test its recent lows should we stray from our central scenario.
Trading view, what’s next?
Mieneke Perniskie – Trader, Financial Markets
In December, our view was that the Kiwi had further downside, driven largely by interest rate differentials, and the absolutely glacial pace of recovery for the Kiwi economy. We saw the Kiwi track lower from the 0.5800 levels, thinking it would go to 0.5700 then pondering a move to a low 0.5500ish. We could see plenty of downside risks abounding – which indeed came to fruition. The Kiwi did trade down to the 55c level (0.5516 was the low). We had initially thought it would take longer for the Kiwi to hit that potential bottom, but the worm turned with the Trump 2.0 trade, and we spent January and February under the pump as the US dollar was favoured. And now we are in a slightly different world, with different risk factors taking centre stage. The protectionist strategy has turned on the US economic outlook, and the US dollar has abandoned what looked like an unstoppable rally. US exceptionalism is being questioned, and the great ‘Tariff Debacle’ is the key part of the story. The markets are pivoting, or appear to be pivoting away from the US exceptionalism standard. Equity markets have borne the brunt of the risk off outcome. There are many dire warnings from analysts about the US economy, and the market has started to price in more cuts than the Fed has signalled. Fed Chair, J Powell tried to put a dampener on those concerns following the March FOMC meeting. But sentiment, understandably, is fragile and markets volatile.
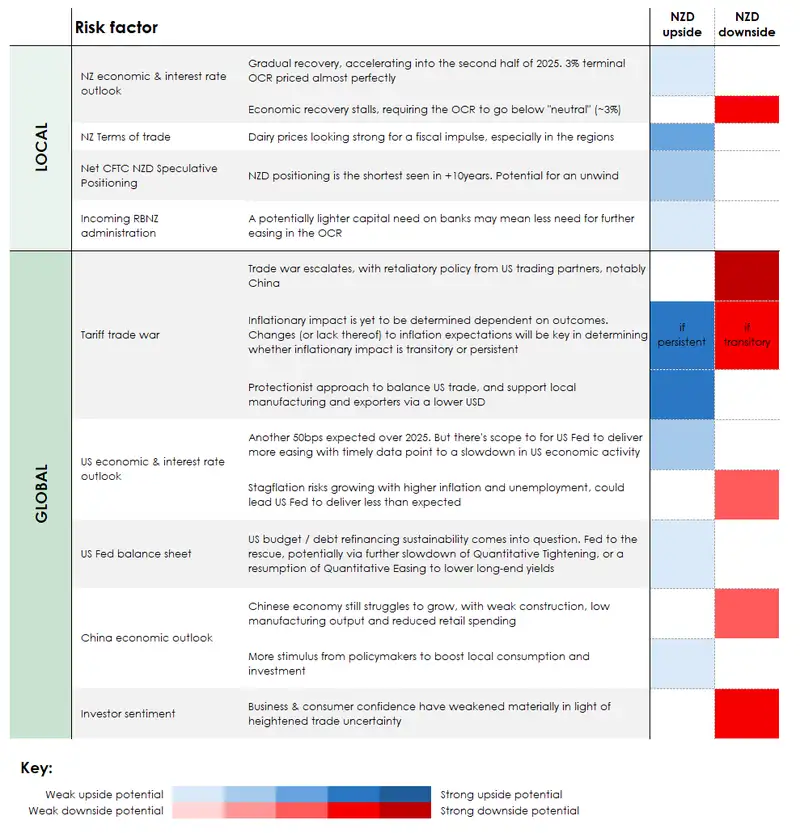
The US dollar has now lost its shine, partly due to the rising Euro (more on that shortly). In a nutshell, we think that the Kiwi has likely traded to the bottom of its current cycle, and now it appears to be finding some support at 0.5700/0.5750 with some tentative upside potential. We think ultimately the Kiwi might end up around the 0.6000 mark at the end of the year. But there is a lot of water to flow under the bridge between now and then. There are definitely still plenty of risks in play for the Kiwi. In the table below, we have attempted to simplify them, as well as provide some form of directional outcome for the Kiwi.
Tariffs are the main headscratcher financial markets, simply because it is proving so difficult (especially with the constantly shifting goal posts) to quantify the risks to various economies. The theme of inflation remains, but central banks have all started to return their monetary policy settings to more ‘normal’ levels. The RBNZ is broadly expected to land at or around 3.0% as their terminal rate. There are some arguments that we actually need to have cuts beyond that, but as with multiple central banks around the world, they are becoming more and more wary of the potential fallout from tariffs. Globally, stagflation is a concern. We may see re-inflation across the globe, and global growth outlooks range from conservative-to-dismal for the G10 economies. Interest rate differentials are also still at play. Rates are fairly anchored in the shorter end, but at the whim of the wider global market further out.
The Euro is the currency we have been watching the most of late. And at the moment, the Euro is giving the US dollar a bit of a run for its money. Eurozone developments that are a direct result of geopolitical and trade tensions, have seen Germany make some big concessions around their debt levels, and they have approved a huge EUR500billion spending package for infrastructure and defence spending. European equities have also been seen as a bit of a bargain compared with the relatively overpriced US equity market. As a result of all of this, the Euro has been trading higher against the US dollar. And the Euro makes up the biggest portion of the .DXY basket of currencies, meaning that it drags the US Dollar lower as it rises. The NZDEUR cross rate has shifted down a few notches, and we are now trading in the 0.5200-0.5350 range. There is further downside potential here of course, especially if we see the Eurozone cobble themselves together and work more effectively to shore up defence and trade strategies. For now, there are a lot of headwinds for the US dollar, the Euro is just one of them. Consumer confidence in the US is now at its lowest level in 12 years, and the various risks to the US economy keep stacking up. If traders are right, it is possible that the Fed do get galvanised into cutting rates more than they anticipate at the current juncture, and this will also see further downside for the Greenback. The Kiwi dollar should be able to mount a recovery up to 0.5850 in the short term.
A (non-exhaustive) list of key Kiwi risks
Kiwi crosses in the months ahead
Hamish Wilkinson – Senior Dealer, Financial Markets
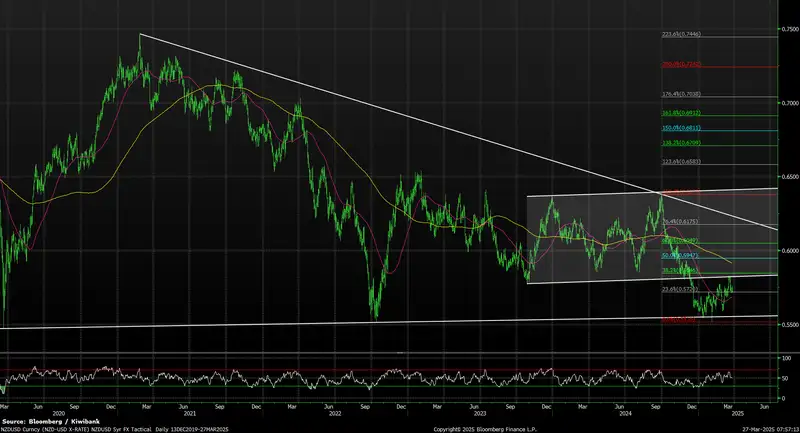
NZDUSD (4-year daily)
Events unfolded faster than we thought! A break out of 0.5820 in the days following the release of our last Tactical saw a capitulation in the Kiwi on the back of the USD exceptionalism and the Trump trade. Ultimately finding support at now a strong triple bottom 55cent region, the Kiwi has slowly but surely found its footing once more. A number of fundamental factors have been responsible for last quarter’s moves, but technical levels have also been respected. The picture looks more balanced. From here, we see a broader 0.55–0.61 range in play with the topside coming into view towards Q3 / Q4 of 2025. For now, USD buyers should consider 0.5840 (recent high and 38.2% Fibo retracement), 0.5945 and then onto 0.6045. On the downside, the current zone around 0.5715/20 may provide some interim support. From there 0.5650 and the much discussed 0.55 cent level becomes at risk. A point to note from a technical perspective - when a triple bottom is threatened for a 4th time, it typically breaches.
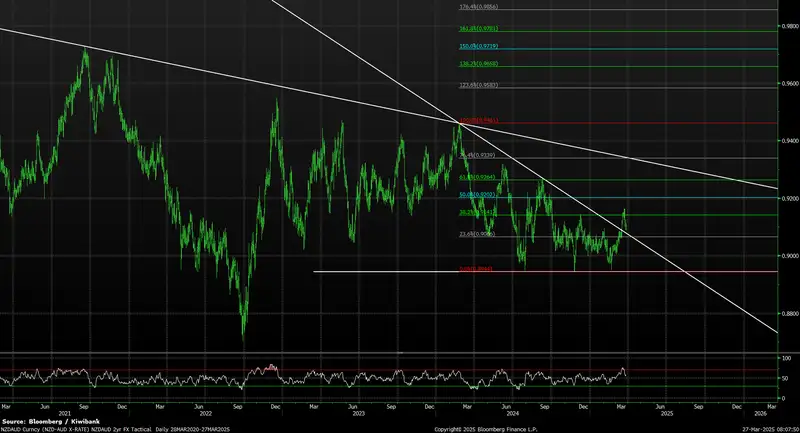
NZDAUD (4-year daily)
Another triple bottom! In our last update, we suggested that 0.8944 was a clear target to be broken prior to the enablement of further downside. Last quarter, NZDAUD witnessed a 3rd and failed attempt to clear this hurdle. As per NZDUSD, now with a triple bottom in place, downside risk has potentially eased somewhat. The recent push higher into our previously mentioned 0.9140 / 70 upside target zone ran into resistance from both an overbought RSI reading and the 38.2% Fibo retracement level. AUD v NZD positioning data combined with a now less diverging rate differential story is also helping to balance the fundamental picture. The RBA is in a moderately dovish frame of mind with 2025 rate easing expectations similar to what the RBNZ is expected to deliver. AUD buyers should consider 0.9170, 0.9200 and 0.9265. Furthermore, 0.9300 has also become more of a possibility when compared to our previous update. On the downside, 0.8944 has become even more important.
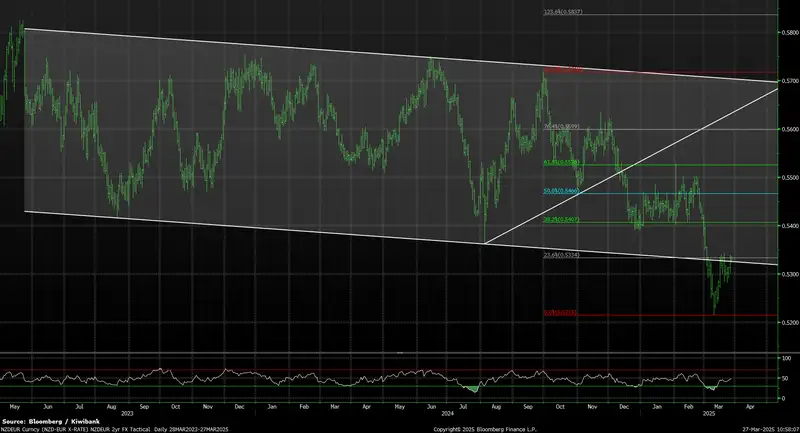
NZDEUR (2-year daily)
The one that we didn’t call…but few foresaw the tectonic changes to the global geo-political framework now being put into place! Increased European government spending plans and a pivot in investor appetite from US to European assets saw the EUR outperform across the past quarter. The break of 55cents following the Trump inauguration gave way to further declines into the 23/ 24 lows circa 54cents. Following a brief period of consolidation, the early March US / EU fallout saw the EUR become the default risk aversion currency. After somewhat of a recovery from an oversold 0.5215 low, NZDEUR now finds itself vulnerable to a potential move to Covid lows at 0.5020. Current levels represent a key upside resistance zone to be cleared before any further meaningful recovery is possible. EUR buyers consider current levels for short term requirements. From there, retracement levels from the 0.5718-0.5215 decline represent good target levels.
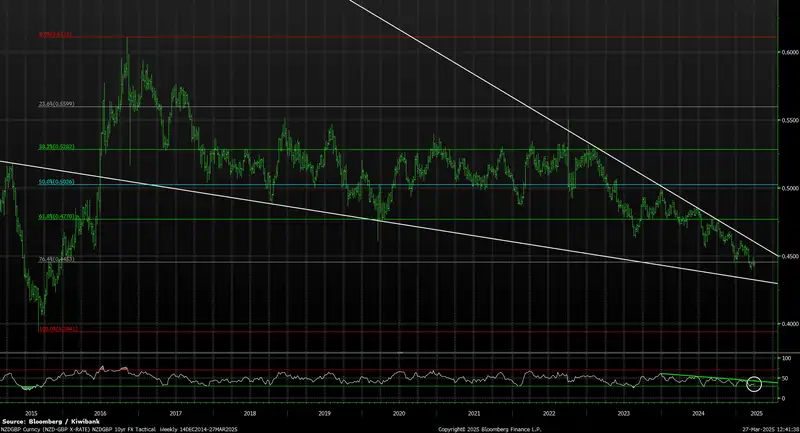
NZDGBP (10-year weekly)
Still searching for a solid footing. In the last tactical we favoured a view of an eventually break of 0.4550 to enact a move into 0.4453 over Q1. This has played out as expected. A similar fundamental outlook when compared to the EUR sees NZDGBP maintaining a continued path lower. From this point, longer term downside support levels are becoming thin albeit a defined 10-year pivot support region exists circa 0.4325. Should this break, then a “3-big figure” becomes a potential reality. But for now, this remains a low chance given that broader momentum indicators are approaching oversold levels. Note in the bottom panel, weekly RSI has been largely trending lower for the past 15 months and at some point, may see a reversal breakout. Upside targets exist at 0.4490 and a break of 0.4580 would see a reversal of the broader 2022–2025 downtrend.
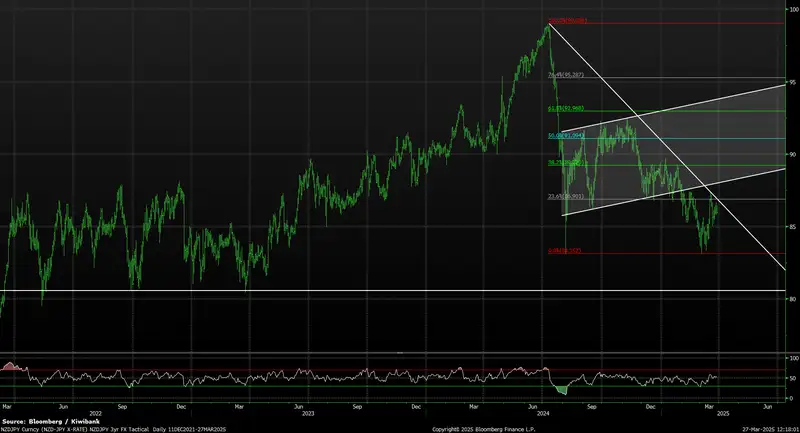
NZDJPY (3-year daily)
Yields continued to converge over the past quarter. A further 45bp of narrowing in 2-year NZ/JPY Govt bond spreads (now circa NZGB 3.62% vs JGB 0.86%) has seen further downward pressure on NZDJPY. A break of channel support at 86.80 opened the door for a retest of the 83.15 low and in doing so, establishing a medium-term double bottom support level - a target for JPY sellers to consider in the short / medium term. BOJ is still expected to maintain its slow and gradual pace of rate tightening throughout 2025, supporting further moves in NZDJPY. A break of 83.15 opens our ultimate downside target towards 80.50. To the upside, a clearing of 86.90 would be required for a refreshed targeting of 89.20 and late 2024 highs above 90cents.
Glossary
Commodity currencies: include the Kiwi dollar, Aussie dollar, Canadian dollar, Norwegian krone as well as currencies of some developing nations like the Brazilian real. These countries export large amounts of commodities (raw materials like oil, metals and dairy) to the world. And commodity currencies are highly correlated with the global prices of such commodities. When the global economy is strong and demand for commodities is high, commodity prices and thus commodity currencies, tend to outperform. The Aussie and Kiwi dollars are famously known for the sensitivity to good news (risk on) and bad news (risk off).
Interest rate differentials: The difference between the interest rates earnt on two different currencies. New Zealand may offer a significantly higher interest rate than those in Japan, for example, and we see an inflow of Yen into Kiwi dollars (known as the “carry trade”). The widening, and narrowing, of interest rate differentials can have a material impact on capital flows and therefore the exchange rate.
Monetary hawk (hawkish) and Monetary dove (dovish): Characterisations of central bank monetary policy. The hawk is a bird of prey and describes a central bank aggressively raising interest rates to slow economic growth and tame the inflation beast. The peace-loving dove however, reflects a central bank trying to stimulate economic growth by cutting interest rates.
Moving averages: A common method used in technical analysis to smooth out price data by showing the average over various time periods.
Relative Strength Index (RSI): is a popular momentum indicator used by forex traders to measure the speed and change of movements in currencies. It is a useful tool to evaluate overbought or oversold market conditions, in turn signalling whether a currency pair is due a trend reversal or a corrective pullback in price. Low RSI levels indicate oversold conditions (buy signal), while high RSI levels indicate overbought conditions (sell signal).
Reserve currency: The US dollar is the global reserve currency. The dominance of the US dollar in international trade means most central banks and financial institutions hold large amounts. The majority of FX reserves are held in US dollars. The US currency and debt markets are the most liquid in the world. And liquidity (the ability to buy and sell, especially in times of stress) is important. The next most traded currency is the Euro, but it is nowhere near as popular as the US dollar. About 60% of global reserves are held in dollars, with the Euro attracting only 20%, according to the IMF.
Safe haven currencies: A safe haven currency is one where investors hide from extreme market turbulence. The US dollar tops the list of safe haven currencies. But the Yen and Swiss Franc are also beneficiaries of save haven flows (money searching for safety). If a war breaks out tomorrow, we’re likely to see a spike in the USD, Yen, and Swiss Franc. The Kiwi dollar would be hit quite hard, and fall against these three currencies. Gold is also considered to be a safe haven asset during times of stress.
Support and Resistance levels: These are chart levels that appear to limit a currency’s price movement. A support level limits moves to the downside; a resistance level limits moves to the upside.
Terms of trade: The ratio of the prices at which a country sells its exports to the prices it pays for its imports. Put simply, terms of trade is a measure of a country’s purchasing power with the rest of the world. How many imports can be purchased per unit of exports – import bang per export buck. An increase in our terms of trade means New Zealand can purchase more import goods for the same quantity of exports. And a rising terms of trade lifts the incomes of exporters and the businesses and communities that support them.
All content is general commentary, research and information only and isn’t financial or investment advice. This information doesn’t take into account your objectives, financial situation or needs, and its contents shouldn’t be relied on or used as a basis for entering into any products described in it. The views expressed are those of the authors and are based on information reasonably believed but not warranted to be or remain correct. Any views or information, while given in good faith, aren’t necessarily the views of Kiwibank Limited and are given with an express disclaimer of responsibility. Except where contrary to law, Kiwibank and its related entities aren’t liable for the information and no right of action shall arise or can be taken against any of the authors, Kiwibank Limited or its employees either directly or indirectly as a result of any views expressed from this information.


