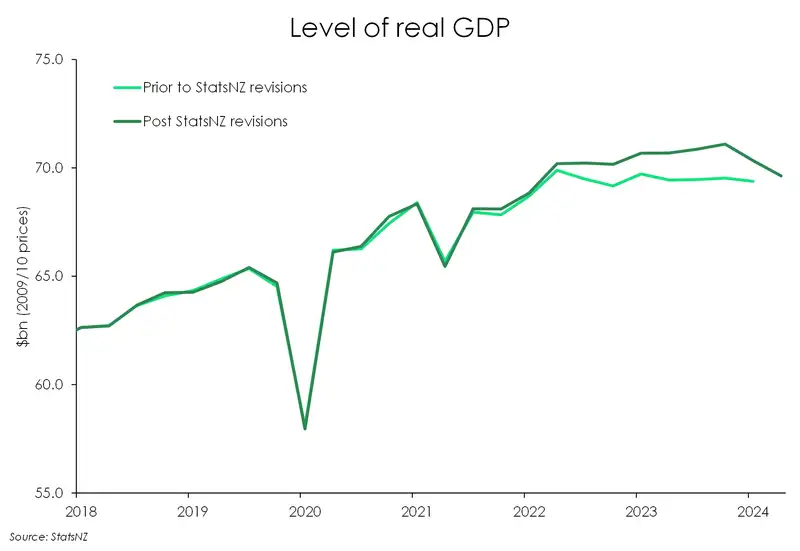
- Yes, the 1% quarterly decline in activity is huge. And it’s much weaker than anyone had anticipated. But the overall size of the economy since the last checkup (Q2) is little unchanged. In fact, the economy is slightly larger (0.4%) than previously estimated. Basically, off a stronger starting point we are now seeing sharper declines in activity. It’s a snowball effect.
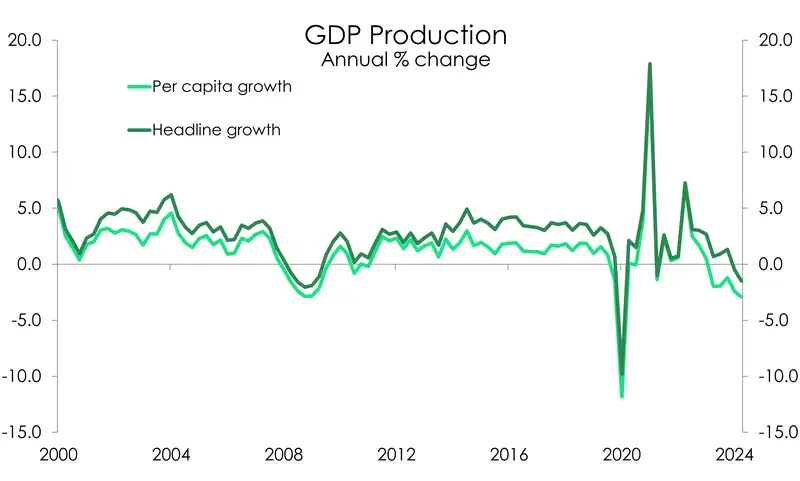
- Excluding Covid periods, the Kiwi economy recorded the weakest 6month period since 1991. And weakness is spreading across most industries.
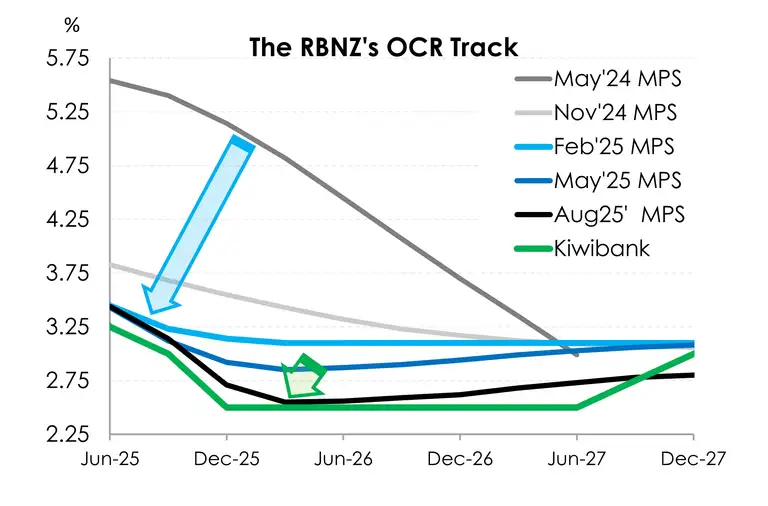
- The light at the end of the tunnel is upon us. The September quarter should mark the final quarter of the economy in decline for this cycle. The additional 100bps of cuts that took place over the December quarter should provide some relief to the Kiwi economy in the current quarter. And with further cuts to come, 2025 should be a much better year. High interest rates have hurt, and the economy demands more easing.
The Kiwi economy contracted a hefty 1% over the September 2024 quarter. And last quarter’s -0.2% contraction was revised to a significantly weaker 1.1%. Compared to the RBNZ’s and market consensus of another -0.2% contraction, or a -0.3% contraction that we had expected to see, the 1% fall in the economy may seem to set off immediate alarm bells. But reader beware, the larger falls have not changed the overall size of the economy. Methodological changes from StatsNZ in their GDP calculation have seen historical prints revised upwards over a longer period in previous quarters. And those tweaks have balanced out the bigger falls in the June and September 2024 quarters seen today. Essentially, the end point of the economy is not too different from what was originally published in June. But the path in getting there has changed. Technical recessions bookending 2023 have been technically revised away. The economy was stronger than originally thought in the earlier parts of the past year. But now, we are facing much sharper declines. Nonetheless, the actual size of the economy is still 0.4% larger than what was published for the June 2024 quarter, given recent revisions to data prior to Q2.

The Kiwi economy may be marginally bigger than previously estimated. But that’s not to say we’re in a much better place. Because excluding covid periods, the past 6 months have been the weakest 6-month period since June 1991! And weakness is broad-based. 11 of the 16 industries reported declines over the September 2024 quarter. At the same time, the per capita breakdown continues to deteriorate – despite a significant cooling in net migration. On a per person basis, the economy contracted 1.2% over the quarter, and 2.7% over the year. Per capita output has been shrinking since the December 2022 quarter. That’s eight straight quarters in decline, with a cumulative drop of 4.8% - far deeper than the 4.2% during the GFC.

All up, things are really ugly on the ground. It might be a good time to remember that we had flagged the RBNZ had potentially over-tightened. Today’s release, coupled with a faster than expected deceleration in inflation suggests as much. Aggressive on the way, up, they’re shaping up to be aggressive on the way down. Today’s release of yesterday’s data supports the (largely baked in) 50bp cut to the cash rate in February.
Today’s report was a dim read, no doubt. But there is good news coming. The September quarter should mark the final decline in economic output in this cycle. And with an extra 100bps of cuts over the December quarter, Q4 should be a better quarter. Though with rates still well above neutral we’re not expecting anything that will shoot the lights out. We still have a bit of time (and more rate cuts to come) before the Kiwi economy regains momentum. But our outlook for 2025 is positive.
The breakdown.

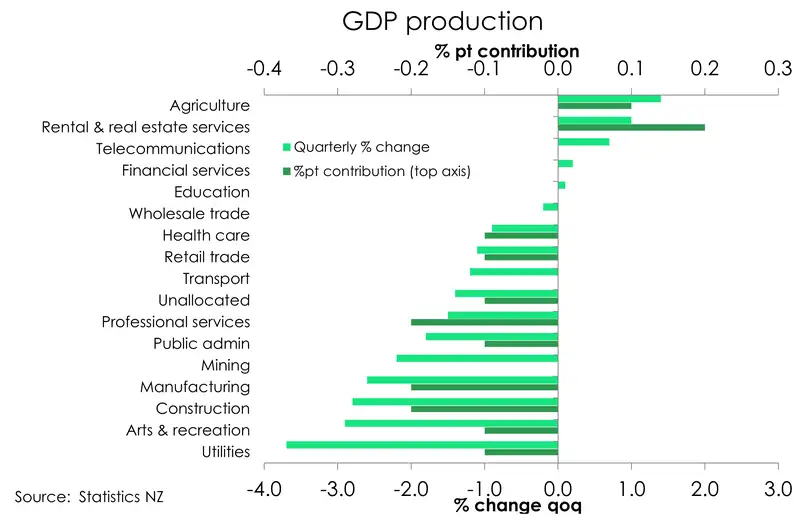
As widely expected, the goods producing sector weighed heavily on the economy over the September 2024 quarter. Contracting 2.8% over the quarter, the goods producing industries accounted for most of today’s decline.
Breaking it down, manufacturing, construction and the utility services (electricity, gas, water, etc.) all posted some chunky declines. With PMIs still signalling contraction over the September quarter it was no surprise to see manufacturing post a 2.6% decline. Meanwhile weak building activity and lower consents over Q3 forewarned the 2.8% decline in construction. Construction and manufacturing are two of the more highly interest rate sensitive areas in the economy, and as such have been hit hardest throughout the RBNZ induced recession. By the same reason, both construction and manufacturing should start to feel some prompt relief as rate cuts continue into 2025. A pencilled in recovery in the housing market next year should also bring about activity to the construction industry.
Unrelated to interest rate sensitivities was the 3.7% fall across the utility services. Disruptions to electricity generation as a result of low hydro generation saw a surge in wholesale electricity prices over the quarter. And had flow on effects to the manufacturing sector.
Weaker services, with a 0.5% quarterly contraction over the quarter, also acted as a drag on the economy. Particular soft spots were seen across the business services, public admin space, and arts & recreation industries. Rising unemployment and public sector cuts are having a material impact in both the professional and public admin services with each sector contracting 1.5% and 1.8% respectively. And with the labour market set to loosen further, it’s likely we’ll see more weakness in the professional services into next year. In contrast a bright spot in the services was the 1% lift in the rental, hiring and real estate group. We suspect activity is picking up in this industry as recent interest rate cuts have sparked interest in the housing market.
Additionally, there was some good news in the primary industries which lifted 1% over Q3 thanks to some strength in the agri space. Higher dairy production and a lift in dairy exports, combined with a recovery in forestry saw the activity in agriculture lift 1.4% over the September quarter.
Spending weak across the board.
On the other side of the same coin, the expenditure measure of GDP declined 0.8% on the quarter, following a downwardly revised 0.8% fall over Q2 (from flat). All three sub-categories were in decline. Household spending fell 0.3%, government spending declined 1.9%, and gross capital formation was down 2.9%.
Private household consumption decreased 0.3%, driven by a fall in household essentials (groceries, utilities etc). Non-durables dropped 1.2% over the quarter. Services also declined 0.1%. Spending on durable goods rose 0.6% over the quarter, however remains 2.1% below last year’s levels. Households are reining in their big-ticket spending as tight financial conditions weigh on wallets. A substitution effect looks to be in play. Consumer imports of low-value goods have increased, up 30% compared to last year. Call it the Temu effect, as the Chinese behemoth of an online retailer enters and disrupts the market.
Beyond households, business investment contracted a hefty 2.5% over the quarter. Compared to a year ago, the decline in investment continued, falling 1.9%. Investment in plant and machinery has taken a large hit, down 11%yoy. It comes as no surprise with several business surveys having pointed to weak investment intentions over 2023. Similarly, the downtrend in building consents has seen a 11.2% decline in residential buildings compared to a year prior. Overall gross fixed capital formation is down 5%.
The Kiwi at 55c is within reach.
It was an early start for market traders and strategists this morning. The US Fed delivered a 25bp rate cut, taking the funds rate (upper bound) to 4.50%, from 4.75%. No surprises there; the Fed has scaled back its pace of rate cuts from the initial 50bp move in August. But next year, the Fed looks to pump the brakes on rate cuts even more. The dot plot was the key focus, which now forecasts just two 25bps of cuts in 2025 – down from the four cuts pencilled in previously. The terminal rate was also revised higher to 3% from 2.7%. It follows the lift in inflation projections over 2025, around which Fed members also see upside risk.
The hawkish cut and hawkish dot plot triggered a selloff in US bonds. The benchmark 10year Treasury yield spiked around 13bps, close to breaching 4.5%, the highest level since June. The USD gained with the Kiwi falling close to a cent, down to mid-56s. But no rest for the weary. A knee-jerk reaction to the weak GDP print saw the Kiwi fall another leg lower. The Kiwi to trade below 57c, at 56.15 at time of writing. In our recently published FX Tactical (Keep calm and carry Kiwi. We hit 58c, on track for 57c… Will we hit 55c?), we flagged the risk of the Kiwi approaching 55c early next year. At this rate, we could we see the Kiwi hit 55c before Christmas. Interest rate differentials are certainly keeping downward pressure on the Kiwi.
The RBNZ is peeling away from most of its central bank peers in cutting interest rates. The RBNZ was among the most aggressive central banks in lifting rates, and are shaping up to be aggressive on the way down. The economy requires such easing. We expect a third consecutive 50bp rate cut in February. We argue the need to get the cash rate below 4%, asap. It takes up to 18 months for rate cuts to filter through the economy. We all love fixed rates. And fixed rates need time to roll off. Effectively, the RBNZ are cutting today for an economy at the end of 2025, the start of 2026. Beyond February, we see the RBNZ delivering another 75bps of cuts to return policy to more neutral settings. Inflation has fallen to 2.2%, earlier than expected. And there’s growing risk of inflation undershooting the RBNZ’s 2% target as the labour market continues to deteriorate. Policy settings no longer need to be restrictive.
All content is general commentary, research and information only and isn’t financial or investment advice. This information doesn’t take into account your objectives, financial situation or needs, and its contents shouldn’t be relied on or used as a basis for entering into any products described in it. The views expressed are those of the authors and are based on information reasonably believed but not warranted to be or remain correct. Any views or information, while given in good faith, aren’t necessarily the views of Kiwibank Limited and are given with an express disclaimer of responsibility. Except where contrary to law, Kiwibank and its related entities aren’t liable for the information and no right of action shall arise or can be taken against any of the authors, Kiwibank Limited or its employees either directly or indirectly as a result of any views expressed from this information.


