Wage inflation continued to rise, but at a slower pace
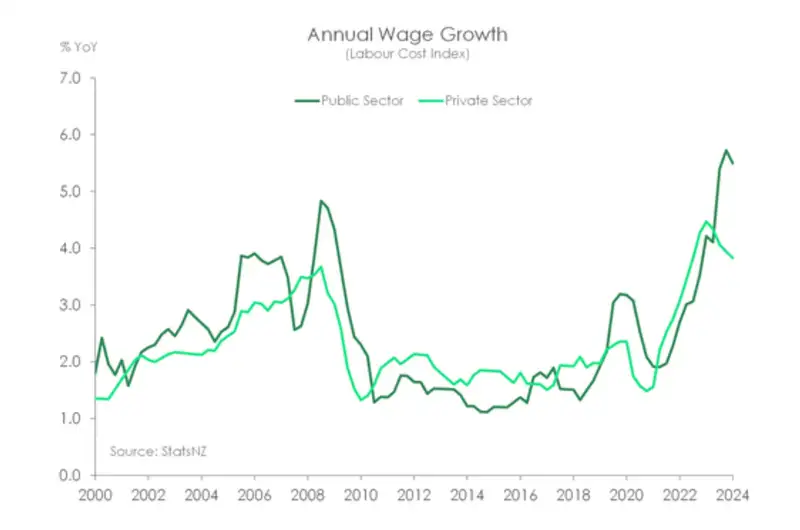
Annual wage growth has slowed to 3.8%, moving further – albeit slowly – away from the 4.5% peak. Weaker wage inflation should help drive an easing in domestic inflation.
Amid the slowing economic landscape, the labour market should continue cooling in the coming year. As demand for labour wanes, the unemployment rate is still on track to exceed 5% by year-end. It’s some distance form the 3.2% low, but we’d deem it a widely-desired ‘soft-landing’.
A weak labour market report
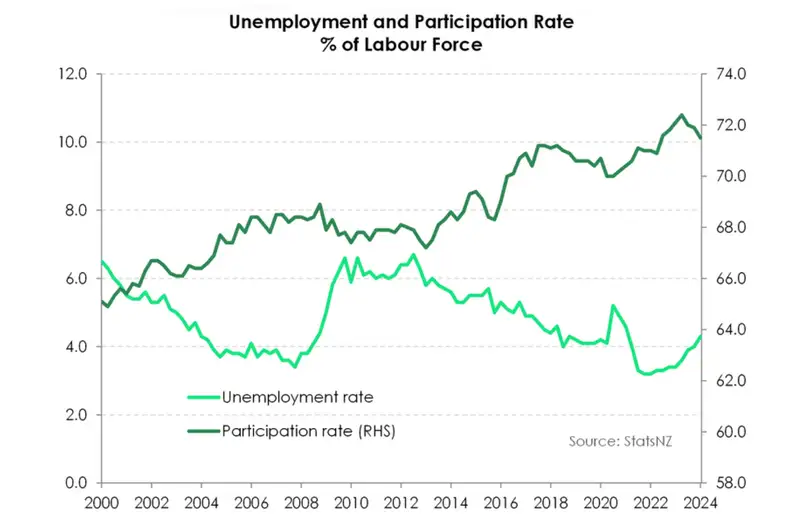
There's only one way to characterise the labour market report, and that's weak. The unemployment rate rose to 4.3% from 4%, marginally above our 4.2% estimate. People are stepping out of the market. Because demand for workers is waning. Employment contracted 0.2% over the quarter, taking annual employment growth to just 1.2%, down from 2.7%. The working age population however, grew 3.1%. The labour force is struggling to absorb the rapid increases in population, due to the surge in migration.
The participation rate fell to 71.5% - the lowest since June 2022 – as workers headed (or were forced) to the exits. The lift in the "not in the labour force" group was made up of older workers (aged 65 years and older) and teenagers (15-19 years). This is a reversal. We saw a big lift in older people remaining in work, and teenagers being attracted into the labour force post-Covid. No more.
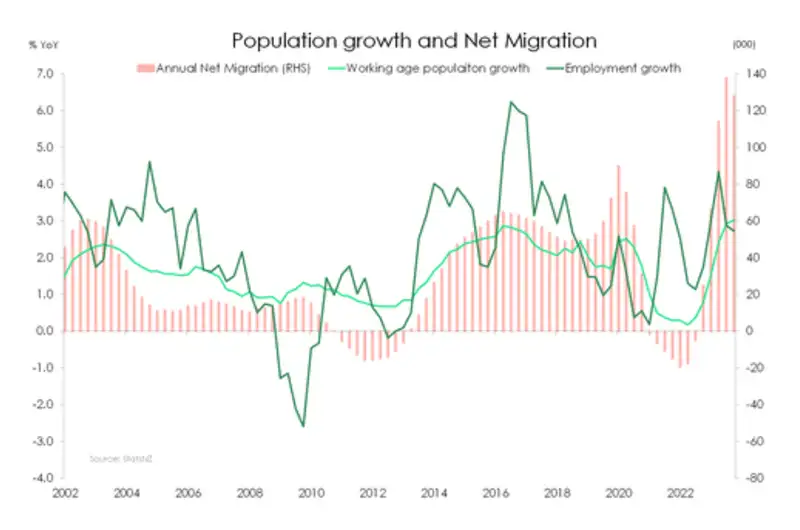
Looking at the underutilisation rate – a better measure of slack in the market – rose to 11.2% from 10.7%, the highest since March 2021. However, beneath the umbrella term, the number of underemployed – those working part-time and wanting more hours – actually declined. It seems to follow the decline in the part-time labour force which shrunk 0.5% over the quarter.
Everything washes out in wage growth. And wage growth is cooling. Private (LCI) wages were up 0.8% on the quarter, and 3.8% on the year (down from 3.9% last quarter and a 2021 peak of 4.5%). We expect the weakening in wages growth to continue. The report showed a large 66% of workers receiving pay rises. But fewer were seeing pay rises above 5%. More and more had to accept pay rises between 3-and-5%. That's the first sign of softening employer demand.
We must remember that the Kiwi economy has been through a significant recession. Four of the last five quarters have recorded a contraction. And we've seen a massive 3% contraction on a per head (capita) basis. The labour market lags the economy by about 9-to-12 months. So there's still another year of softness ahead.
We expect the unemployment rate to continue climbing over the coming year. By our calculations, it is still on track to exceed 5% by year-end. That’s some distance from the 3.2% low recorded in 2021. But considering 18 months of aggressive monetary policy, we would deem such an outcome as a ‘soft-landing’.
Today’s update was an important one ahead of the RBNZ’s policy update later this month. We don’t think there was much in the data that would force the RBNZ to deviate from its stance. The data definitely doesn’t require a harsher hawkish tone come May 22nd. The labour market is another piece of evidence proving that monetary policy is working. Labour demand is softening. The stickiness in domestic inflation requires rates to remain restrictive for some time yet. However, we still expect the RBNZ to begin the rate cutting cycle earlier than their current track suggests. We have still pencilled in November as the earliest kick-off date.
Youth recruitment slows
Behind slowing employment and an uptick in the underutilisation rate was weakness within both the full-time and part-time labour force. Over the March quarter, the full-time workforce contracted 0.3%, while the part time workforce shrank a further 0.5%. Over the course of the year however, both full and part time employment continue to grow, but at a much slower pace. Full time employment expanded 1% over the year while part time employment expanded 2.1%. Though for part time employment, that’s down from a 9.9% peak in June 2023, and likely explains the growing underemployment rate which rose to just under 30% over March.
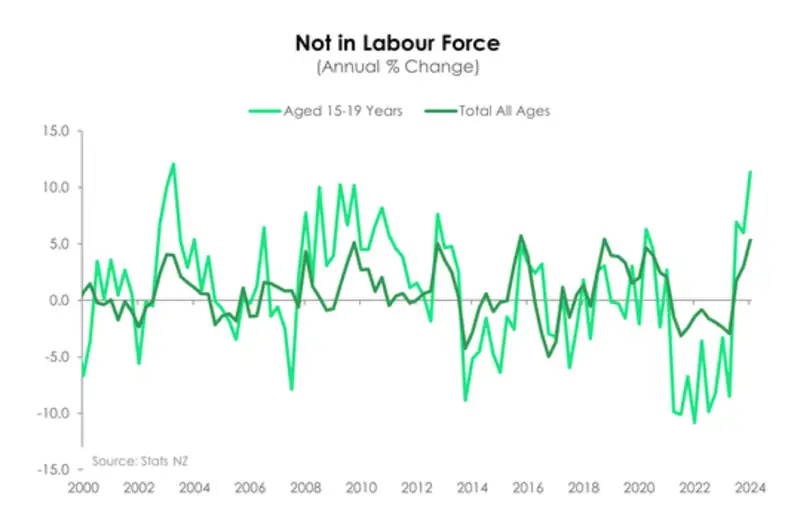
At the same time, a shrinking part time workforce may also explain the growing number of teens (15–19 years) not in the workforce. Over the quarter, the number of teens not in the labour force lifted by 6.8% and is up 11% compared to last year. Similarly, youth employment bore the brunt of the overall fall in jobs. Employment declined by 23k, of which 12k came from those aged 15-19 years. According to Stats NZ, the youth not in employment, education or training (NEET) has lifted to the highest in three years at 14.1%
All up, increasing underemployment, and underutilisation is a sign of what’s to come. In an economic downturn, the labour market is often the last shoe to drop. And firms tend to cut hours first, before headcount.
Slowing wage growth
In another sign that heat is leaving the labour market, wage inflation continued to soften over the March quarter. The private labour cost index (LCI) – a measure of pure wage inflation – rose 0.8% over the quarter, as expected. Annual wage inflation edged down slightly to 3.8% from 3.9%, moving further away from the 4.5% peak recorded early in 2023. Interestingly, there was a slight but significant change in the distribution of annual movements. Of the surveyed salary and wage rates, two-thirds received a pay rise over the last year, not too dissimilar to the December quarter print of 65%. However, of those receiving a pay rise, a smaller share (37% from 39%) enjoyed an increase of more than 5%, while the proportion receiving a pay rise of between 3-and-5% grew to 21% from 18%. It follows the fall in consumer price inflation and inflation expectations. Employers and employees are now adjusting from inflation running in the 7s to the 6s, 5s, and now 4%. Psychologically, we now have 4% in the back of our minds when it comes to setting prices and, evidently, wages.
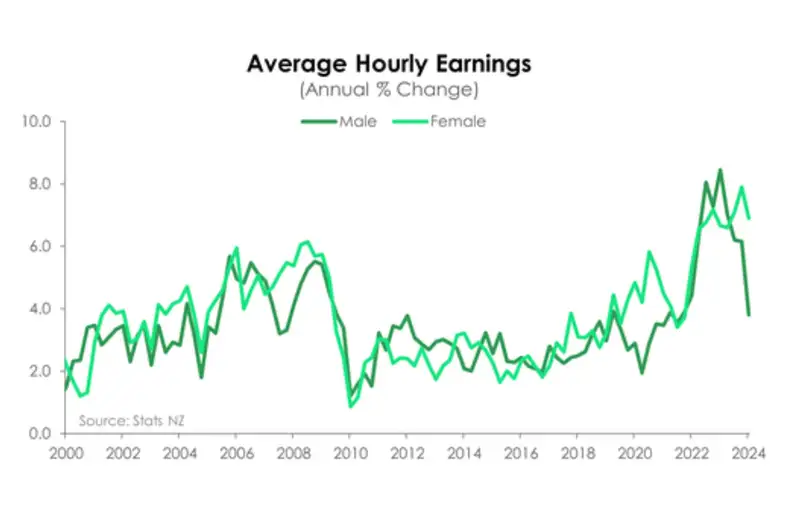
Similarly, the Quarterly Employment Survey (QES) showed just a 0.3% increase in average hourly earnings over the quarter – the weakest growth since 2016. Annually, this measure – which does not take into account changes in the composition of jobs – slowed steeply from 6.9% to 5.2%.
Weaker wage inflation will help drive an easing in domestic inflation. Currently, the pace of consumer prices is running faster than wage growth. The good news is, we see the current cost-of-living pressures easing soon. We expect wage growth will soon exceed consumer price inflation. It’s been a long time coming.
Wow, women’s wages went well up
A highlight of the report was to see the way women’s wages have performed over the past 10 years. Average hourly earnings among women doubled in the last decade, up $12.91, while men experienced a 43% increase. It likely follows the wider dispersion of women within the labour market, branching out of low-paid occupations traditionally held by women. In saying that, nearly a third of all jobs held by women are in health care and education industries. The 7% rise in women’ hourly earnings in the year to March was largely driven by the pay increases within these two industries. In the same period of time, men’s wages grew 3.8%, down from 6.2%. Discrepancies between the level of wages between men and women remain, but it’s encouraging to see an acceleration in women’s wage growth.
Market reaction
The weaker than expected result, or dose of reality in the face of a prolonged recession, caused market traders to rethink. Wholesale swap (interest) rates fell across the curve, with the 2-year rate easing back to 5.08%, from 5.13% before the data release. Swap rates had been pushed higher, a lot higher, in recent weeks. The 2-year hit 5.21% last Friday, having risen from a low of 4.79% 3 weeks ago. That's a big rethink higher. Thoughts of RBNZ rate cuts had evaporated after the stronger than expected domestic inflation recorded in the first quarter of this year. The first cut priced into markets is still November, but the conviction is a little stronger today. OIS pricing has about 5.15% priced, so that's a full 25bp cut (to 5.25%) with the chance of a 50bp move being contemplated. We think market pricing is about right, for now. Yes, only expect 25bps in November (with a very slim chance of a 50bp), but February is bang on at 4.96% (so a full 50bp plus 4bps in change). Further out, market pricing is too light, in our view. The terminal rate of 4% is more likely to be 3%. And that's a trade for later in the year.
The Kiwi currency didn’t do much at all. Before the data, the Kiwi was at 0.5890. After the data, the Kiwi hit a low of 0.5875 and stabilised around 0.5881. It was hardly worth a mention. What is worth a mention, is the recent decline from over 0.62c early in the year. We've long highlighted the likely descent in the Kiwi flyer. The bird is destined to hit 0.57c on our forecasts. We're sticking with the view. Please note that the likely fall in the Kiwi is a double-edged sword. It helps our exporters. A lower Kiwi puts NZ on sale, and gives travellers a discount, or makes buying our dairy or kiwifruit that much cheaper. On the flip side, the cost of importing goods goes up, adding inflation we don't want or need.
All content is general commentary, research and information only and isn’t financial or investment advice. This information doesn’t take into account your objectives, financial situation or needs, and its contents shouldn’t be relied on or used as a basis for entering into any products described in it. The views expressed are those of the authors and are based on information reasonably believed but not warranted to be or remain correct. Any views or information, while given in good faith, aren’t necessarily the views of Kiwibank Limited and are given with an express disclaimer of responsibility. Except where contrary to law, Kiwibank and its related entities aren’t liable for the information and no right of action shall arise or can be taken against any of the authors, Kiwibank Limited or its employees either directly or indirectly as a result of any views expressed from this information.


