We live in truly fascinating times. Can central banks engineer a soft landing? History would suggest not. Will the signal of the inverted yield curve prove correct? It is highly probable. One thing is certain – it is going to be a bumpy road ahead.
Global outlook
“And there is no map. And a compass wouldn’t help at all. Yeah, uncertainty.” Bjork
Global inflation may be peaking at nearly 10%. The outlook for global shipping costs, and delivery times, has improved markedly. Shipping costs are falling as supply chain disruptions are resolved. And capacity is likely to grow with a steady increase in new ships being built. There had been a significant underinvestment over the last decade. The Covid pandemic induced the perfect storm. Demand for goods, globally, surged as we spent less on services. Ports were congested as lockdowns caused the unthinkable, and ports suddenly had to comply with stricter health regulations and social distancing. And all of this happened after global shipping capacity had failed to keep up with demand – even before Covid hit. It appears the worst is behind us. We hope… The fall in shipping costs and delivery times is a welcome disinflationary force.
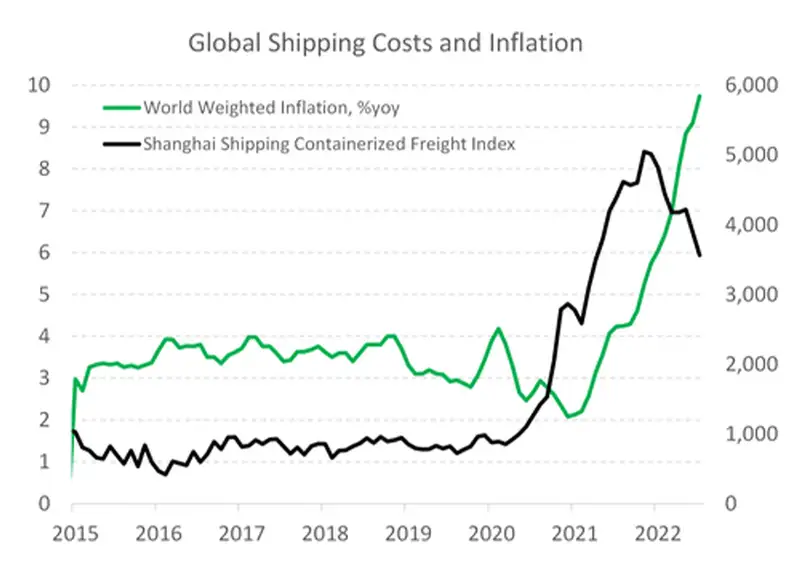
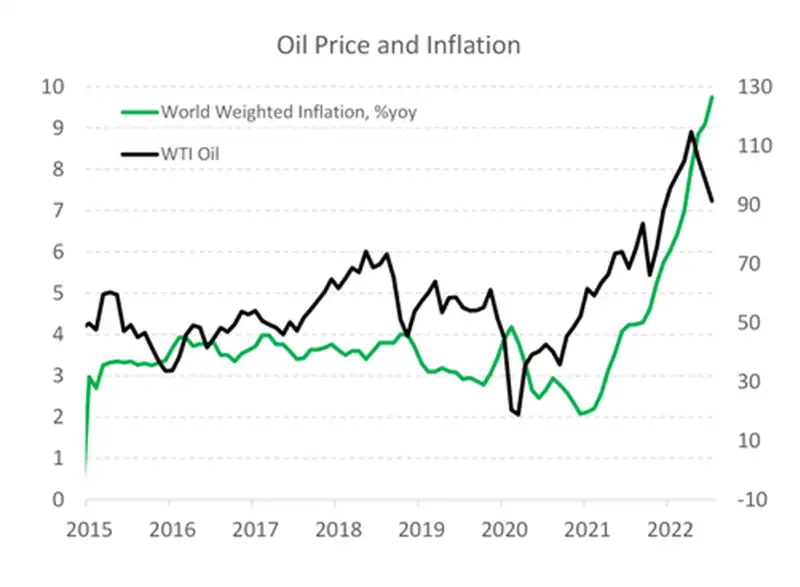
Commodity prices have also fallen from lofty levels. As the outlook for global growth continues to deteriorate, so too will the outlook for commodity prices. Although supply issues remain. We expect to see key commodity prices, including oil, ease into 2023. It will not be a straight line as supply issues flare up on occasion. Half of our inflation has been generated offshore (tradables). And the improvement in inflation expectations offshore should lead to a swift downshift in imported prices. We are also forecasting a strengthening in the Kiwi dollar, which should help dampen imported inflation.
Inflation outlook
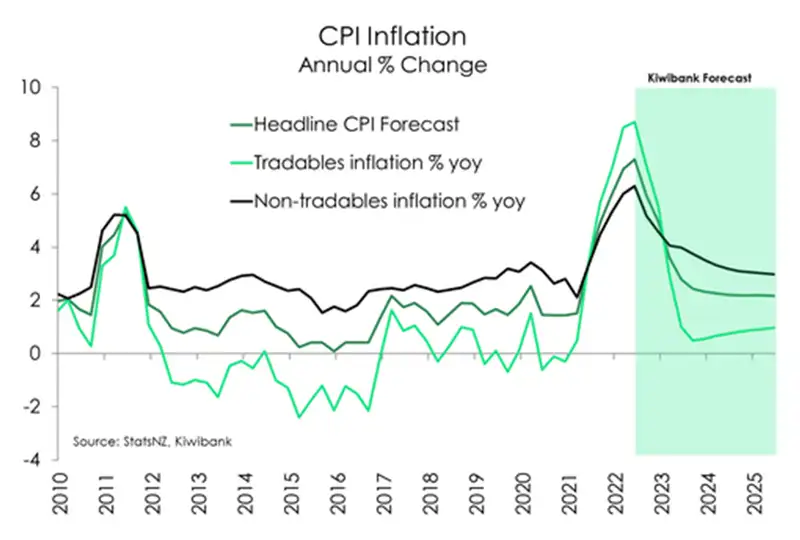
Although the outlook for inflation has improved, there is an element of persistence that will linger still. The other half of our 7.3% inflation rate has been generated locally. And that’s the sticky stuff. Our inflation forecasts, see chart below, have a steep unwinding in tradables inflation, but a more persistent run in non-tradables.
Over the June quarter, the gain in non-tradable (domestically generated inflation) was especially strong. On an annual basis, domestic inflation hit 6.3%. Housing related costs were the main driver, with construction of new dwellings up a whopping 18% over the year. We expect inflation will remain stubbornly above 2% through to the end of 2023.
The RBNZ's policy stance
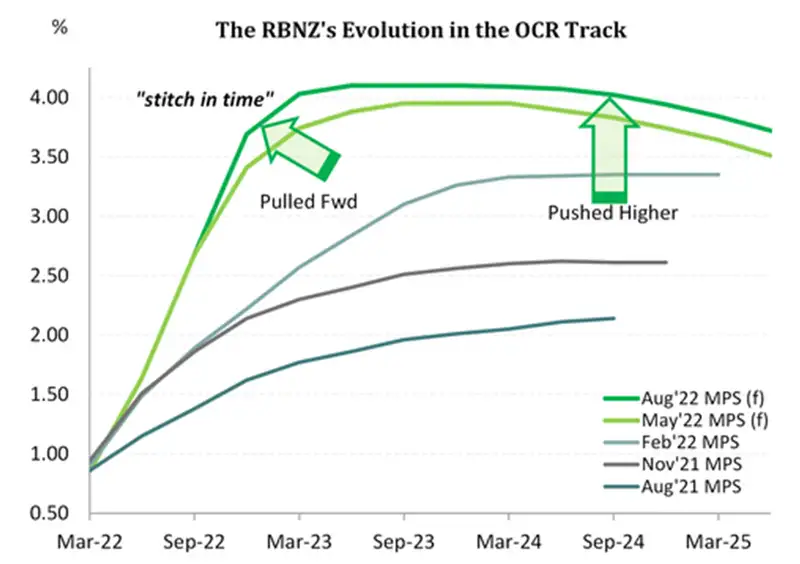
The RBNZ are “resolute” in their policy stance. Inflation needs to fall, and by quite a bit. The central bank’s hawkish commentary has highlighted the upside surprises in domestically generated inflation and the ensuing spike in wages. The RBNZ has acknowledged the risks from offshore, and the slashing of global growth forecasts. But the focus domestically is one of destroying demand to break the back of the inflation beast. More rate rises are required for mandates to be met. We expect another 100bps of tightening. We are likely to see two more 50bps hikes in October and November.
We expect the Kiwi dollar will find some support near term. But as global growth slows and interest rate differentials narrow, the Kiwi dollar could glide lower into 2023.
Army of me
“You're on your own now. We won't save you. Your rescue squad, is too exhausted.” Bjork
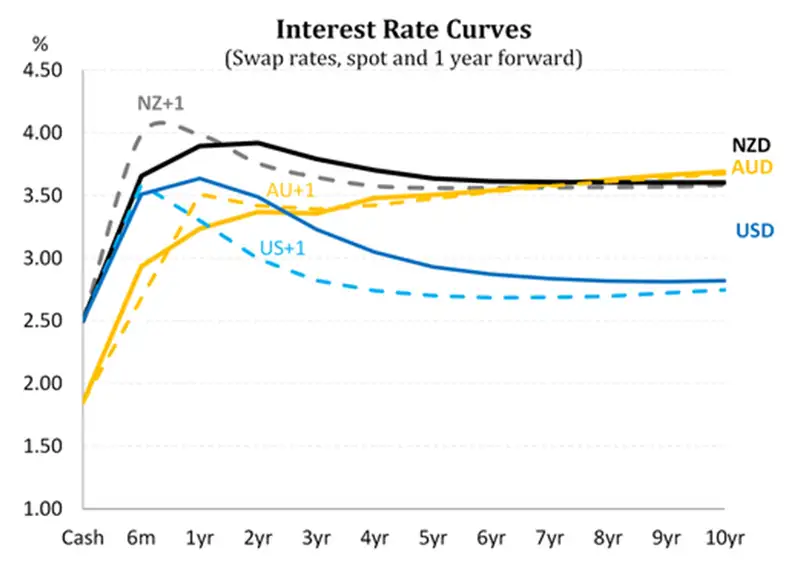
The chart above is quite simply the most beautiful chart we have. Interest rates tell you everything you need to know about the current situation. And the interest rate curves of the US, Australia and New Zealand are inverting. The inversion is a big red flashing warning sign. And expectations of the ‘next’ move in interest rates is lower.
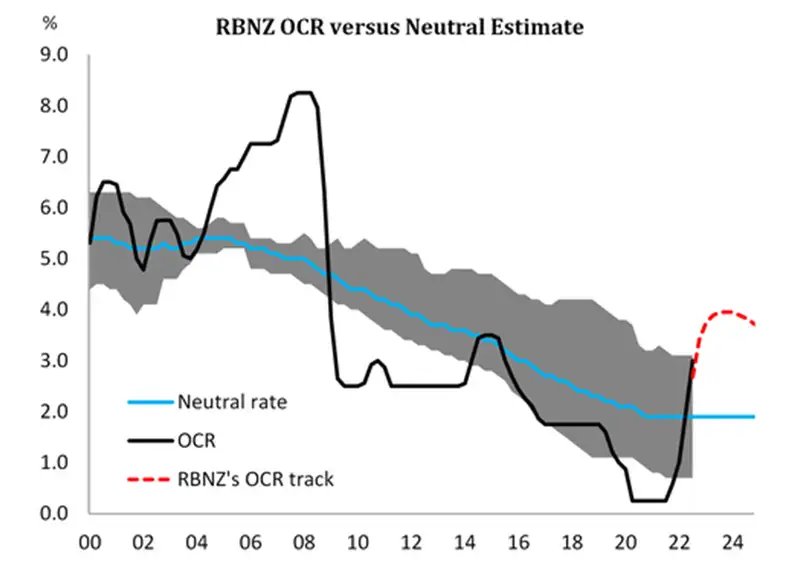
The RBNZ have outlined a tightening in policy unseen in the post-GFC (2008) period. Interest rates have been hiked into ‘restrictive territory’ and will restrain economic growth further. Our next chart illustrates the ‘neutral’ (neither restrictive nor
stimulatory) cash rate – blue line – and the actual cash rate – black line. The RBNZ’s proposed OCR track is highlighted with the red dotted line. We are currently at 3%, well above neutral, and the RBNZ has forecast a continued hiking of the cash rate to 4%. If delivered, Aotearoa will face the tightest monetary policy settings since 2008. And of course, the risk of recession rises with every rate rise from here.
Our next chart illustrates the policy stance (restrictive versus stimulatory) and the shape of the Kiwi swap curve (2-year versus 10-year swap rate spread). Since 2009, monetary policy in Aotearoa has been broadly stimulatory. Policy was only returned to neutral briefly in 2014. The shape of the Kiwi rates curve is largely driven by monetary policy (expectations). When monetary policy is loosened to stimulate growth, short term interest rates fall as the cash rate is slashed. And longer-term interest rates hold up or actually rise as higher growth and inflation is expected, as a result of policy stimulus. The curve is said to steepen. Conversely, when interest rates are hiked to tighten policy, short-term rates rise at a faster clip than longer-term rates. And the further tightening goes, the greater the reduction in future growth and inflation expectations, which pulls down longer-term rates. The curve is said to flatten.
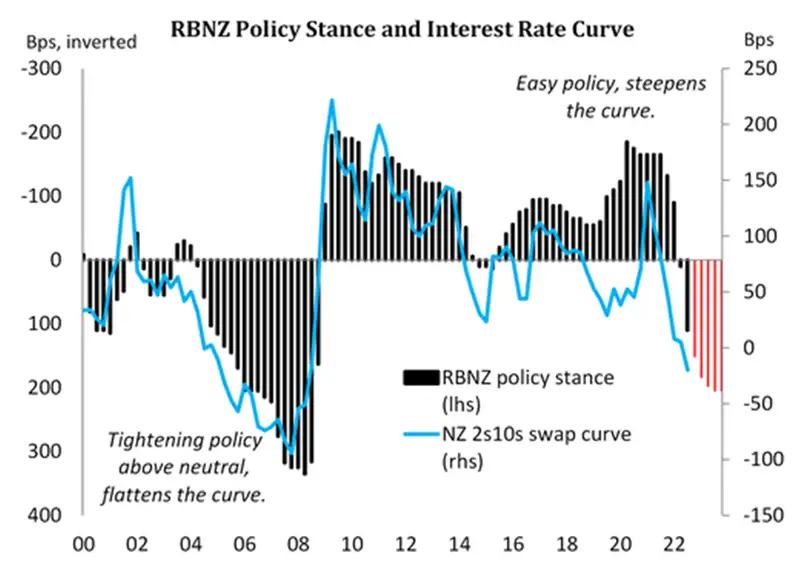
Since the RBNZ started hiking the cash rate, the Kiwi swap curve has flattened, and has now inverted. We had flagged the likelihood of an inverted curve for many months. The more the RBNZ tightens, by hiking the cash rate, the more the Kiwi curve will invert. An inverted curve, is a signal that a recession may be on the horizon.
The RBNZ’s move into restrictive territory is well underway. Mortgage rates have already lifted materially in anticipation. We expect the RBNZ’s policy action to keep a flattening bias on the Kiwi curve as the risk of recession rises with every rate rise. The “inversion signal” from financial markets may grow stronger in coming months and quarters.
We expect the curve to fall deeper into inversion. The signal of an impending slowdown will only grow stronger. The deep(er) inversion will continue to foreshadow a significant slowdown in growth, and even recession in parts.
The next big move for the Kiwi curve, will be the exact opposite. As inflation eases and growth stalls, the next move for policy will be an unwind. We expect to see interest rates cut late in 2023. In anticipation of rate cuts, the curve will steepen materially. It will be a bull steepening. As interest rate cuts are delivered, the steepening will quicken. Eventually, higher growth and inflation expectations will emerge as policy stimulus takes hold – further steepening the curve. It is likely to be a wild ride.
Violently happy
"Come calm me down, Before I get into trouble." Bjork
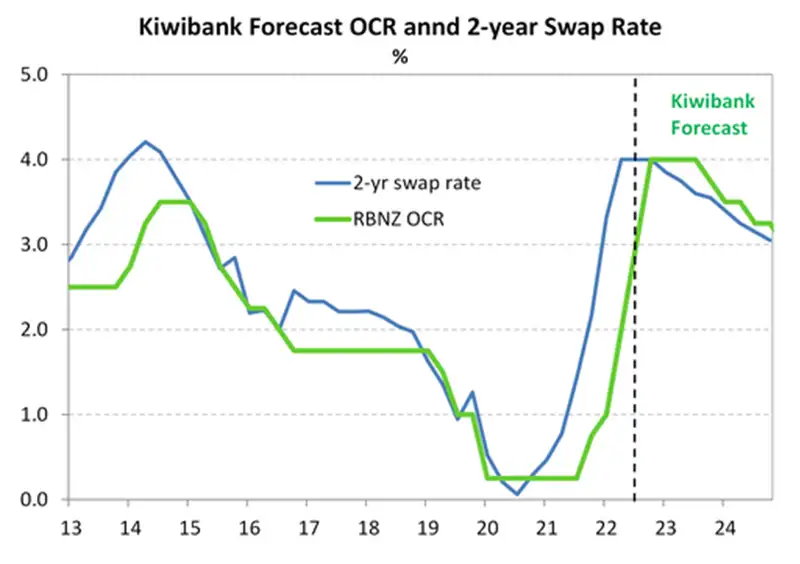
Financial markets have been volatile, to put it politely. Interest rates have risen swiftly, and looked to have peaked in June. Expectations for the peak in the RBNZ’s cash rate were ratcheted higher to 4.5% in June, with the pivotal 2-year swap rate hitting a peak of 4.55%. Since then, expectations have come back, with a terminal rate of 4% priced into the Kiwi short-end. The 2-year swap rate is trading just over 4% (at time of writing).
The spike in June saw mortgage rates push higher. The retracement lower in July have enabled banks to lower mortgage and business lending rates. It’s fair to say the RBNZ will have seen the move lower in lending rates as something they don’t want to continue – hence the hawkish rhetoric. We believe the slight lift in the RBNZ’s OCR track was a deliberate attempt to stabilise market pricing around a 4% terminal.
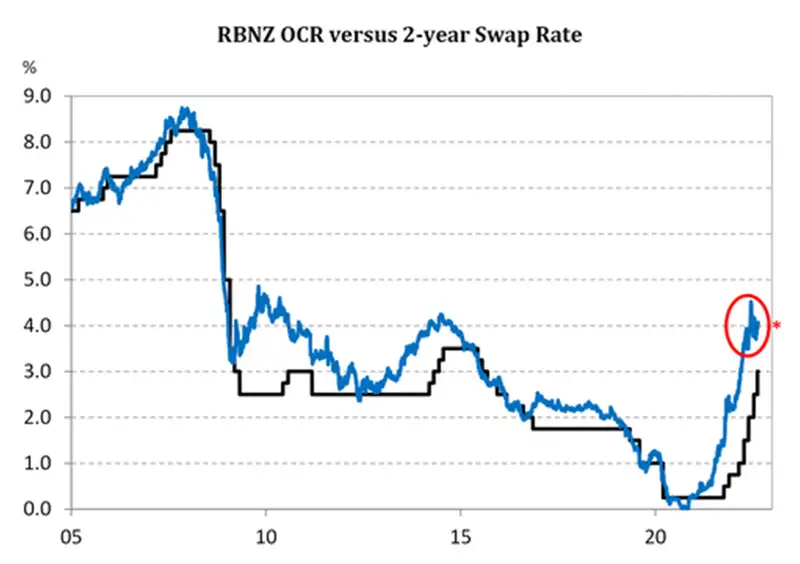
We believe the market is perfectly priced, for now. We expect the 2-year swap rate to trade in a relatively narrow range around 4% for the rest of the year and into 2023. We believe the OCR will eventually be lowered back towards a more neutral setting, with rate cuts in the second half of 2023. The timing of the unwind will depend on the global backdrop. A global recession would cause a sharp drop in interest rates. Whereas a soft landing would see interest rates ease at a much more modest rate. We’re forecasting a soft landing for the Kiwi economy. But the risks are certainly tilted towards a deeper correction.
“For currency markets, much of the focus in the past 6 – 9 months, has been on the timing, size and ultimately the terminal level of global central bank tightening. The US Dollar has been of major focus. When it comes to ultra-hawkish monetary policy settings, the Fed is considered the ‘biggest bull’ in the room. But with inflation potentially having peaked for the US, there’s a possibility that the Fed will not need to hike rates as aggressively in the coming months. However, it is still almost a certainty that they will meet current market expectations of an approximate 3.5% Fed Funds rate by Xmas, and a touch higher into 2023. More tightening is clearly needed to ensure inflation is indeed brought back under control. From this point, expectations have started to build for rate cuts in the second half of 2023 in the US.
This “peak” rates story has seen a reversal in the Greenback’s seemingly endless rally. A falling US Dollar should provide a boost to riskier currencies, like the NZ Dollar. It’s a play we saw unfold following a slightly softer US inflation print. The Greenback weakened, and the Kiwi rallied to 0.6450. So where to from here?
We see the Kiwi benefitting from a continuation of the anticipated 2023 intertest rate differential play, strong NZ terms of trade and the slight hint of a soft landing in the US supporting risk assets – including the risk correlated NZ Dollar.Mieneke Perniskie, Kiwibank Trader & Hamish Wilkinson, Kiwibank Senior Dealer
But this will be highly dependent on the Fed’s approach into the end of the year. There will likely continue to be dips in the Kiwi with the ebb and flow of risk sentiment, as we wait to see the outcome of a soft landing versus a recession.” Mieneke Perniskie and Hamish Wilkinson
The Kiwi currency is driven by global risk sentiment, commodity prices and interest rate differentials – which incorporate relative economic performance.
Global sentiment is fragile, with talk of recession in the US and Europe. And China’s growth has disappointed. Risk appetite may be an impediment for the Kiwi dollar. Ultimately, we expect the “safe haven” flow into USDs too reverse into 2023. Assertive Fed tightening will have a material impact on consumption and investment. We also expect Chinese growth to improve into 2023 with further stimulus and a bounce back in activity from recent Covid related lockdowns.
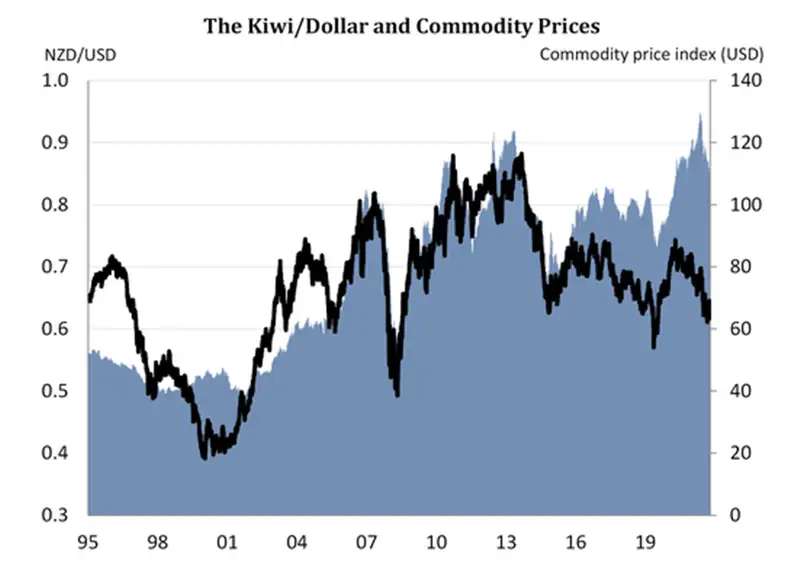
Global commodity prices are easing. Falling commodity prices will weigh on the Kiwi dollar. But we expect Kiwi (soft) commodity prices to hold relatively well. Our terms of trade remains well above longer term averages.
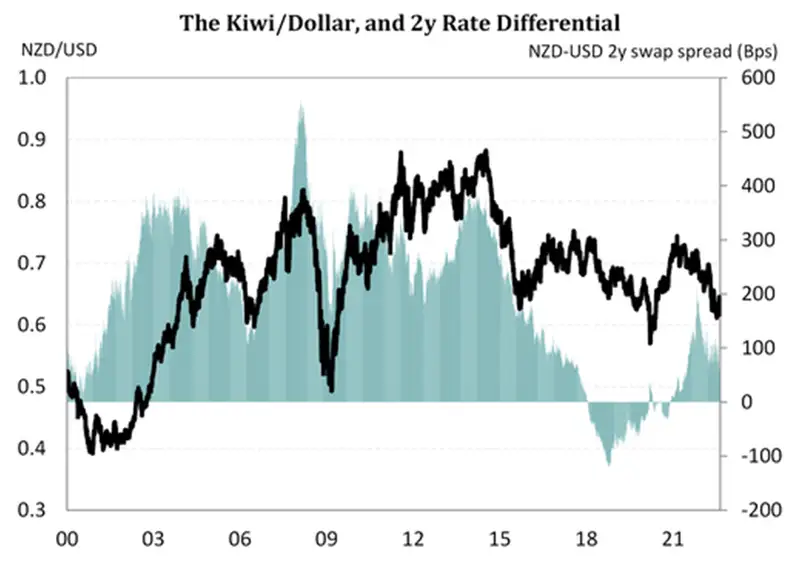
Interest rate differentials are likely to support the Kiwi dollar into 2023. We believe the slowdown in the US, and Europe, will be worse than the slowdown in New Zealand. A recession in the northern hemisphere would see interest rates fall faster and deeper than interest rates in New Zealand and Australia.
We have lowered our year-end forecast for NZD/USD to 67c (down from 71c). We have pushed out our forecast climb to 71c to mid-2023.
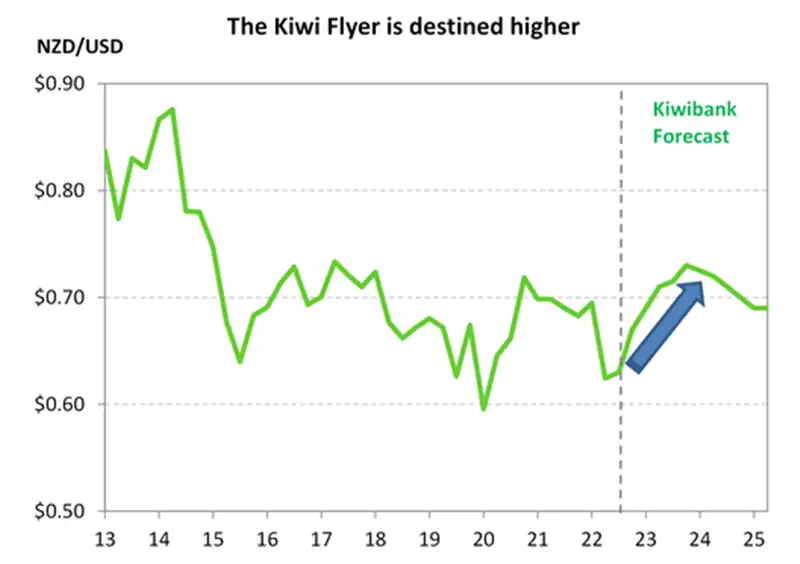
If you’re an exporter, hedging exposures to a rising currency can assist. We suspect we are near the bottom of the 2022 range for the NZD/USD. We’re expecting a near term push back up to 65c. Because expectations for US Fed (and other central banks) tightening have been fairly priced.
If you’re an importer, 67c is likely by year end. And we’re forecasting a move to 71c by mid-2023. Beware of negative press, central bank jawboning and downside scenarios.
All content is general commentary, research and information only and isn’t financial or investment advice. This information doesn’t take into account your objectives, financial situation or needs, and its contents shouldn’t be relied on or used as a basis for entering into any products described in it. The views expressed are those of the authors and are based on information reasonably believed but not warranted to be or remain correct. Any views or information, while given in good faith, aren’t necessarily the views of Kiwibank Limited and are given with an express disclaimer of responsibility. Except where contrary to law, Kiwibank and its related entities aren’t liable for the information and no right of action shall arise or can be taken against any of the authors, Kiwibank Limited or its employees either directly or indirectly as a result of any views expressed from this information.


