- The Kiwi housing market has seen a sharp correction, and is still struggling to make ground. REINZ house price data recorded another fall in July. But we’re looking to next year, with rate cuts thick and fast.
- Investors have been hunted by policymakers, both from the last Government and RBNZ. Interest rate deductibility, Brightline tests, and laser focussed LVR restrictions have all targeted investors. Precisely what we don’t need with a chronic housing shortage. But now, the hunted will become the hunters.
- The RBNZ will take interest rates from very restrictive levels, to much less restrictive, and possibly stimulatory, levels. Interest rates are the biggest driver of house prices. Tailwinds are coming. As the DTIs take effect, we expect to see a further loosening in the LVRs. And investors no longer need to worry about the Brightline test or interest deductibility. With the rise in rental yields, investors should return to the market.
- Hunters will seek opportunities in a ‘buyers’ market. Interest rates will play a big role. Rates are faling. The RBNZ’s cut last week was the first step in a twelve step walk back to neutral. The true test will come in Spring, as the property market thaws out from a cold winter.
It’s time to lift our heads, and look to growth next year. The RBNZ has finally started cutting rates, with an economy that has been in recession for 2 years. Unemployment is rising as we see a lift in business failures and defaults. The Kiwi housing market is still struggling to regain its footing. The good news is that the RBNZ has decided to reduce the amount of monetary policy restrictiveness. And ultimately, they will head back to a neutral, Goldilocks, level for rates. See our RBNZ update: The RBNZ cuts, because it was the right thing to do. And it’s the magnitude that matters most.
We believe conditions are improving, and we’re looking for a return of the investor into next year.
The latest REINZ data for July showed another step back, falling 0.33% over the month, to be up just 0.2% over the year. The annual rate is effectively flat, after showing some signs of life earlier in the year (with the annual rate popping up over 3% in February). It was rather mixed across the regions. Auckland underperformed, recording a 1.6% decline over July, to see house prices down 2.4% over the year. Excluding Auckland, Kiwi property prices were up 0.5% in July, and 1.5% over the year. But the pain was also felt in the capital. House prices in Wellywood fell 1.75%, to be down 0.3% over the year. There were also some big declines in Northland (-1%mom, -3%yoy), Hawkes Bay (-1.3%mom, -0.7%yoy) and Taranaki (-0.5%mom, +0.14%yoy).
The South Island continues to outperform the North, with some solid gains in Canterbury (+1.1%mom, +4%yoy), and Otago (+2.3%mom, +7.6%yoy). And although Southland recorded a slight fall of 0.6% in the month, house prices are up 7.14% over the year. See our regional section below.
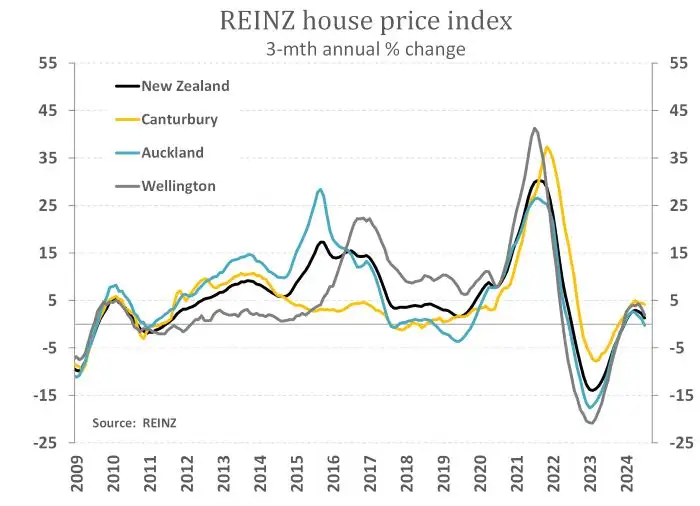
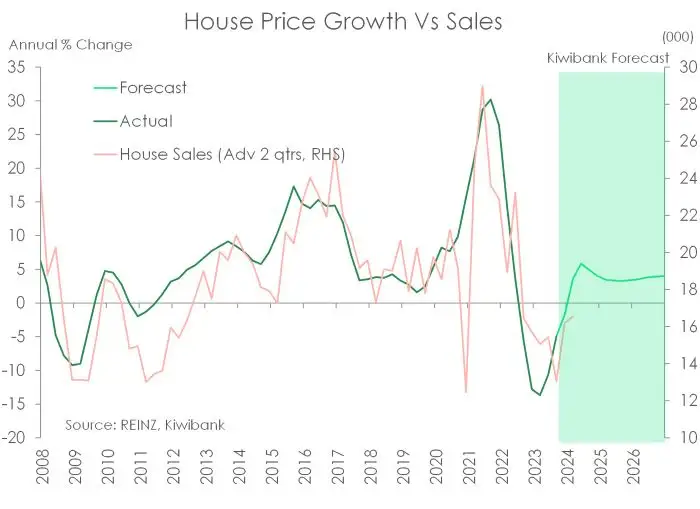
The chart above highlights the amazing volatility in house prices over the Covid period, and how house prices are flattening off now. The correction that started in November 2022, and lasted 18 months to May 2023, recorded an 18% decline (with price falls recorded in 15 of the 18 months). The RBNZ induced correction followed “unsustainable” price gains over 2020-21, with an eyewatering 45% spike in 18 months. And here we are, recovering without conviction (yet). The annual gain in house prices sits at just 0.2%. We’re back in the black, after being deep in the red, but confidence is grey.
Looking to later in the year, the decline in interest rates will lift heads, attract investors, and boost confidence.
Time waits for no (man) land
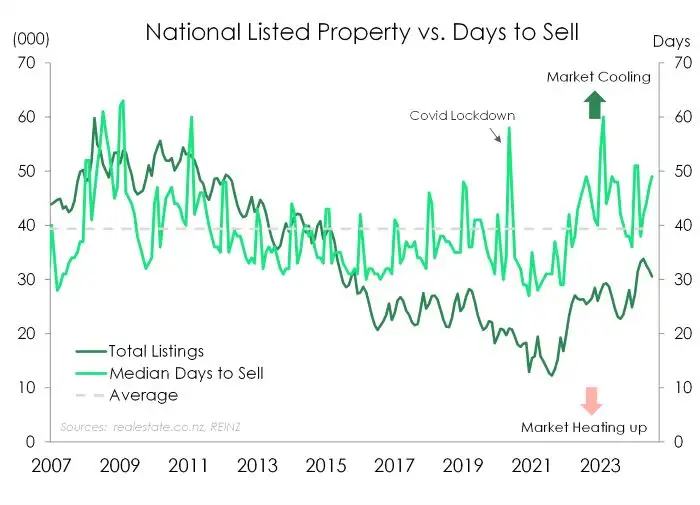
The median days to sell a property lengthened, again. It is simply taking longer to clear housing stock. At the national level, the days to sell rose to 49 from a recent low of 42. 39 is about average. 49 is far from average. The time it takes to sell a property is one of the best real-time indicators of housing market dynamics. And despite some volatility, (volatility that will persist for the rest of the year), the distance between buyers and sellers is widening, for now.
Total listings also rose, and reflects the difficulty in selling.
The two capitals followed each other south
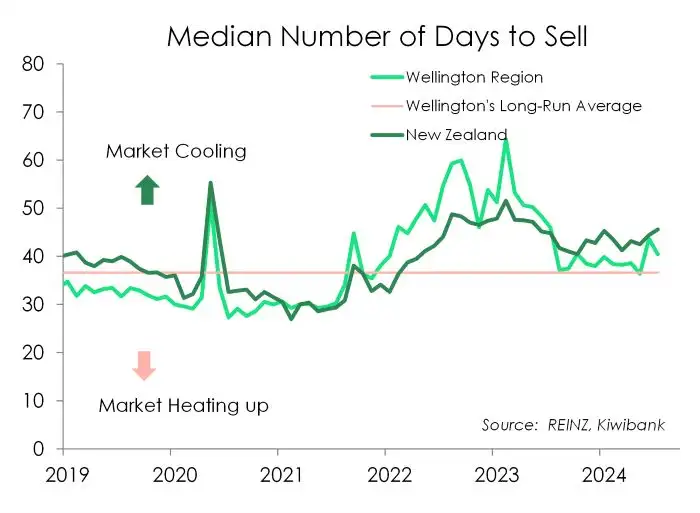
In the “official” capital, house prices fell 1.75%. And Wellingtonians will be weighing up the impact of significant job cuts in the public sector. There will be flow on effects. Prices are now down 0.3% in Wellywood over the year, and follow a sharper 25% correction from the post-Covid boom. Wellington has underperformed. Sales are soggy, and the days to sell have lifted from a respectable 36 to 46.
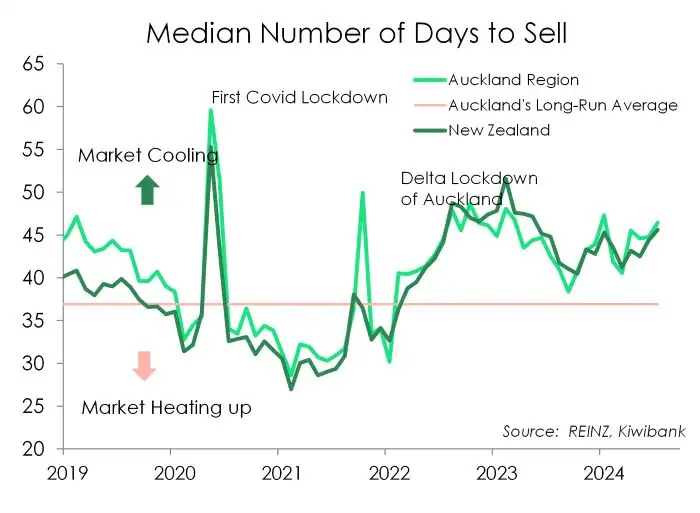
In the “real” capital, house prices fell 1.6%. Activity in the city of sales (or lack thereof) is weak, with the days to sell rising from a recent low of 39, back out to 48. The long-term average is 37, and anything above 40 is considered soft. 48 days is the definition of a buyers market. It’s taking time for properties to sell, a sign of weakness.
The performance of the provinces reflects housing
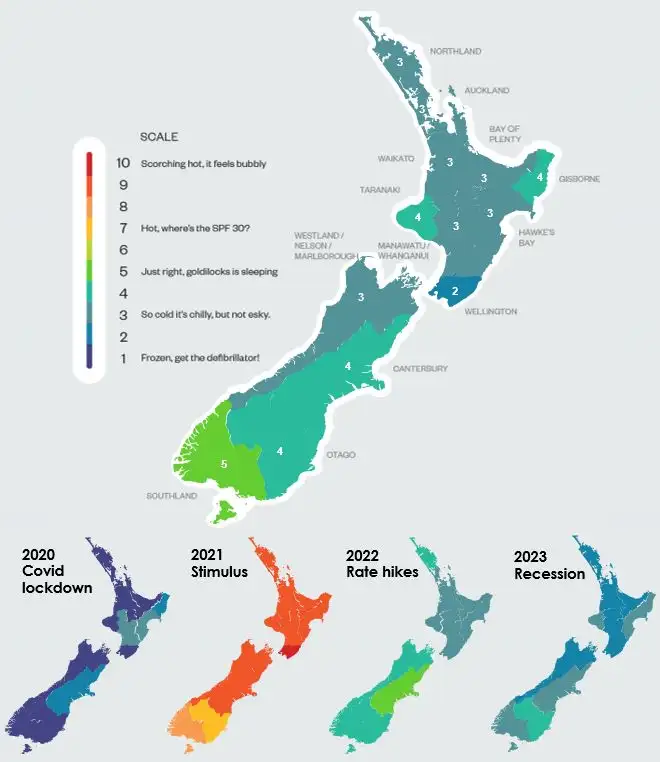
The REINZ housing market data forms part of our latest regional outlook, titled: The regions show signs of recovery. 2025 will be better. In the report, we draw on the insights of dozens of business bankers and mortgage managers across the regions.
“Economic activity has improved across the motu – but only just. Our regional heatmap has gone from flashing mostly 2s out of 10 to a scattering of 3s, 4s, and a single shining 5. The economic scores are still soft, but it’s an improvement nonetheless.
Southland is the top performing region, with activity boosted by a building boom. Auckland’s activity is still weak, despite strong population growth. And it’s feeling bitterly cold in Windy Wellington, with a Jack Frost score of just 2, the same as last year. The bright spots, hidden beneath the surface, reflect the recovery in tourism. Otago is a strong performer.
Looking ahead, inflation is easing, interest rates will fall, and business confidence should strengthen. Spring is coming, and most regions will defrost.”
It’s the return of the… Ah wait, no way… the investor?
Investors are (highly) likely to return over the warmer months. We’re currently lending more to first home buyers than investors. That’s highly unusual, see chart below.

As interest rates fall, investors will be enticed off the side-lines (and out of cash). Rental yields are still rising as rents are running at the fastest pace in over 30 years, while house prices are still falling in (large) parts. And the Government kept its promise to unshackle restraints. The ‘promised’ reintroduction of interest deductibility, shortening the Brightline test timeline, and possible watering down of the CCCFA, will entice investors.
The RBNZ’s rate cut is a gift that will keep on giving
The RBNZ cut the OCR at the August policy meeting for the first time in four years. (See our full review). We’ve spent a lot of time agonising about the timing of the first move. And now that it is out of the way, we’re going to spend a lot more time talking about the magnitude. And it’s the magnitude that matters most.
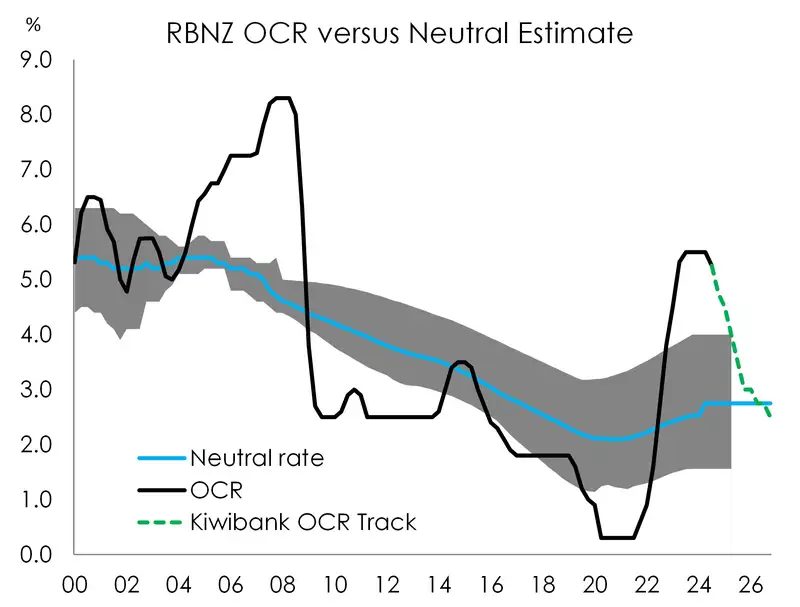
The RBNZ’s August cut was the first in a twelve step move. We expect to see twelve 25bp cuts, so 300bps in total. If the RBNZ wants to remove the restrictiveness of interest rates, they need to go back to a neutral (Goldilocks, not too hot, not too cold) setting. That Goldilocks rate is estimated by the RBNZ to be around 2.75%, a long way from 5.25%. And we think they’ll need to go a little below (2.5%), to get things moving. Mortgage rates, business lending rates have a long way to go, south.
It’s the magnitude of rate cuts that impacts business decisions, and household confidence. We forecast, with a much greater degree of confidence, that 2025 will be a better year than 2024, and let’s put 2023 behind us.
So, what can we expect?
Forecasting is as much an art as it is a science. And we still think we’re much more likely to see price gains over 2025.
The surge in migration will play a role. The demand/supply imbalance will worsen. The surge in migration and the loss of dwellings at high risk of climate change will only exacerbate the housing shortage. The new Government will play a big role. Any added infrastructure spend or incentives for new builds will also be welcomed.
Interest rates will play a larger role, from now.
Our best guess is house prices will rise by 5-to-7% over 2025. Call it 6% to sound precise.
For more detail on the drivers of the Kiwi housing market, see: “Kiwi housing: all you need to know for the great BBQ debate this summer.” We wrote the note in December last year, but the drivers and key messages are still relevant. We talked through the monumental movements in migration, and the chronic shortage of dwellings. And we talk through our recent experiences, and the likely path forward. Basically, we have a housing shortage, exacerbated by surging migration, complicated by climate change related risks, and our policymakers focus more on demand than supply. Supply is the issue. It is increased (or elastic) supply that will better balance our housing market. It’s not about limiting demand.
All content is general commentary, research and information only and isn’t financial or investment advice. This information doesn’t take into account your objectives, financial situation or needs, and its contents shouldn’t be relied on or used as a basis for entering into any products described in it. The views expressed are those of the authors and are based on information reasonably believed but not warranted to be or remain correct. Any views or information, while given in good faith, aren’t necessarily the views of Kiwibank Limited and are given with an express disclaimer of responsibility. Except where contrary to law, Kiwibank and its related entities aren’t liable for the information and no right of action shall arise or can be taken against any of the authors, Kiwibank Limited or its employees either directly or indirectly as a result of any views expressed from this information.


